Summary: how much did the store save?
A clothing store open for business added passive energy-saving panels (HVAC energy-saving panels) to the return-air side of its existing indoor units — no AC replacement, no extra power. After filtering data for the same time slots, similar outdoor temperatures and the same number of running systems, the main test units averaged 7.8% saving in spring and 12.2% in summer; in summer the average hourly energy of all 12 outdoor units fell 13.5%, with 11 units lower. Annualized from the summer rate, that's about 21,219 kWh, about NT$102,000 in power costs and about 10 t of carbon saved.
Why start with existing AC?
Rising power prices, hot summers and carbon targets make air conditioning a focus of retail energy management. But for a store that's open for business, replacing the whole AC system is expensive.
Major equipment upgrade
- Equipment replacement
- High upfront investment
- Longer construction
- May disrupt business
Improve what you have
- Applied directly to existing AC
- No extra power needed
- Can be deployed unit by unit
- Expand based on measured results
In this case the panels sit on the return-air side of the indoor units, improving airflow and heat exchange to help existing AC run more efficiently. The purpose of the test was to confirm its performance in a real commercial space, as the basis for deciding whether to expand.
Testing fairly: condition matching
A store's foot traffic, outdoor temperature and number of running AC units vary every day, so simply comparing total energy before and after isn't fair. This case first filtered comparable data by the following three conditions, then compared average energy before and after installation:
- Same time slots
- Similar outdoor temps
- Same units running
The store has 12 outdoor units (A–L); D, E and F were the main test units, with energy recorded by power metering in the electrical panel. The test spanned spring (2026/2/26–5/26) and summer (2026/5/27–8/5), covering different seasons and AC loads.
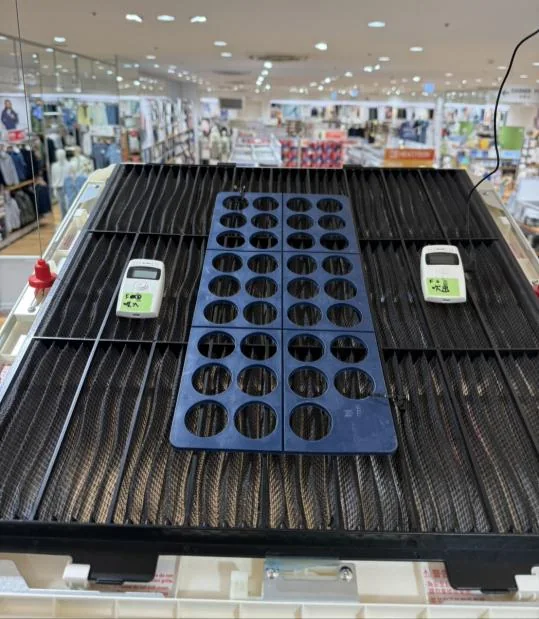
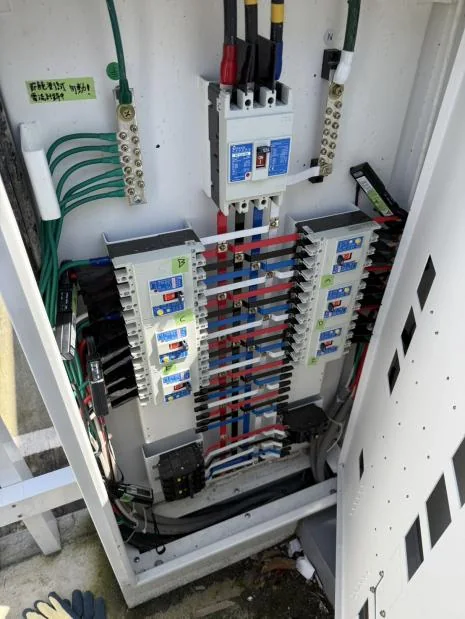
Spring: 7.8% average saving
| Item | Without panels | With panels |
|---|---|---|
| Test hours | 697 hours | 833 hours |
| Setpoint: fitting rooms | 20°C | 20°C |
| Setpoint: sales floor | 23°C | 23°C |
| Average energy (condition-matched) | 3.87 kWh | 3.56 kWh |
Spring energy use at different outdoor temperatures (kWh)
| Outdoor temperature | 17°C | 18°C | 19°C | 20°C | 21°C | 22°C | 23°C | 24°C | 25°C | 26°C | 27°C | 28°C | 29°C |
|---|---|---|---|---|---|---|---|---|---|---|---|---|---|
| Before | 2.43 | 2.45 | 2.55 | 3.01 | 2.63 | 3.56 | 3.79 | 4.20 | 4.54 | 4.78 | 4.84 | 5.10 | 6.38 |
| After | 1.98 | 2.22 | 2.47 | 2.80 | 2.50 | 3.31 | 3.00 | 4.02 | 4.20 | 4.40 | 4.53 | 5.19 | 5.72 |
| Difference | −0.45 | −0.23 | −0.08 | −0.21 | −0.13 | −0.25 | −0.79 | −0.18 | −0.34 | −0.38 | −0.31 | +0.09 | −0.66 |
Energy fell after installation in 12 of 13 outdoor temperature bins; the 28°C bin rose slightly by 0.09 kWh. We show it as measured and don't remove unfavorable data.
Summer: 12.2% saving under heavy load
| Item | Without panels | With panels |
|---|---|---|
| Test hours | 648 hours | 1,008 hours |
| Setpoint: fitting rooms | 20°C | 20°C |
| Setpoint: sales floor | 20~22°C | 20~22°C |
| Average daily energy | 98.49 kWh | 86.45 kWh |
| Saving rate | 12.2% | |
Compared with 7.8% in spring, summer — with higher AC load — showed a more noticeable drop in energy use.
Whole system in summer: all 12 units −13.5%
Beyond main test units D, E and F, the average hourly energy of all 12 outdoor units (A–L) during the test was also compared, as a supplementary view outside the condition-matched analysis. Overall it fell from 15.87 kWh/h to 13.74 kWh/h, down 13.5%.
Average hourly energy of 12 outdoor units (kWh/h)
| Outdoor unit | A | B | C | D | E | F | G | H | I | J | K | L |
|---|---|---|---|---|---|---|---|---|---|---|---|---|
| Before | 1.28 | 0.78 | 1.02 | 0.28 | 1.30 | 4.34 | 1.09 | 1.20 | 0.40 | 2.06 | 0.73 | 1.41 |
| After | 1.16 | 0.69 | 0.85 | 0.35 | 1.17 | 3.58 | 1.03 | 0.95 | 0.36 | 1.76 | 0.68 | 1.15 |
| Difference | −0.12 | −0.09 | −0.17 | +0.07 | −0.13 | −0.76 | −0.06 | −0.25 | −0.04 | −0.30 | −0.05 | −0.26 |
11 of 12 units dropped; Unit D rose slightly by 0.07 kWh/h. This comparison was not condition-matched and serves only as supplementary evidence of the overall trend.
Annual benefit: energy, cost and carbon
Using the 12.2% saving from the summer condition-matched comparison as the basis, the estimated annual benefit is:
| Item | Estimate | Calculation |
|---|---|---|
| Yearly energy saved | About 21,219 kWh/yr | Rated power 136.2 kW × power factor 90% × annual regional average load factor 33.7% (Taipei) × aging factor 0.769 (3 years in use) × 5,475 operating hours/yr × saving rate 12.2% |
| Yearly cost saved | About NT$101,850/yr | Annualized energy saving × NT$4.8/kWh |
| Yearly CO₂ cut | About 10.06 t CO₂e/yr | Energy saved × 0.474 kg CO₂e/kWh |
| Payback | Pays back from year 3 | 7-year net benefit ~NT$787,545 |
These are annualized estimates based on the measured saving rate, not full-year data measured during the test. Actual energy, carbon and payback vary with AC operating hours, load, electricity price, equipment price, installation cost and deployment scale, and need to be estimated case by case.
What does this case tell us?
Saving energy doesn't have to start with new equipment. Improving the efficiency of existing equipment without replacing the AC or disrupting business, verifying it with cross-season operating data, and then deciding whether to expand is a low-disruption path you can take step by step.
This is also how we "prove value with results": publish the test method, list unfavorable data, and clearly separate measured results from estimates.
FAQ
How much energy can energy-saving panels on existing AC actually save?
In this clothing store case, after filtering data for the same time slots, similar outdoor temperatures and the same number of running systems, the main test units averaged 7.8% saving in spring and 12.2% in summer; in summer the average hourly energy of all 12 outdoor units fell 13.5%. Actual results vary with the site, AC type and operating conditions.
Why was the summer saving better than spring?
In summer outdoor temperatures and AC load are higher, so efficiency improvements make a bigger difference in energy use. This case saved 12.2% in summer versus 7.8% in spring.
How should AC energy savings be verified to be credible?
You can't just compare total energy before and after, because foot traffic, outdoor temperature and the number of running units vary daily. This case first filtered comparable data for the same time slots, similar outdoor temperatures and the same number of running systems, then compared average energy, and verified across spring and summer.
Were the annualized savings and payback measured?
No. The annualized saving of about 21,219 kWh, about NT$101,850 in power costs and payback from year 3 are all estimates based on the measured summer saving of 12.2%. Actual benefits vary with operating hours, load, electricity price, equipment price and deployment scale, and need to be estimated case by case.