ESG-driven tech & market partner

From the right technology
to the right customers.

DEYly pairs equipment distribution with B2B market development: we bring in technology whose savings are proven with data, and use SEO, GEO, ads and overseas outreach to find it customers.

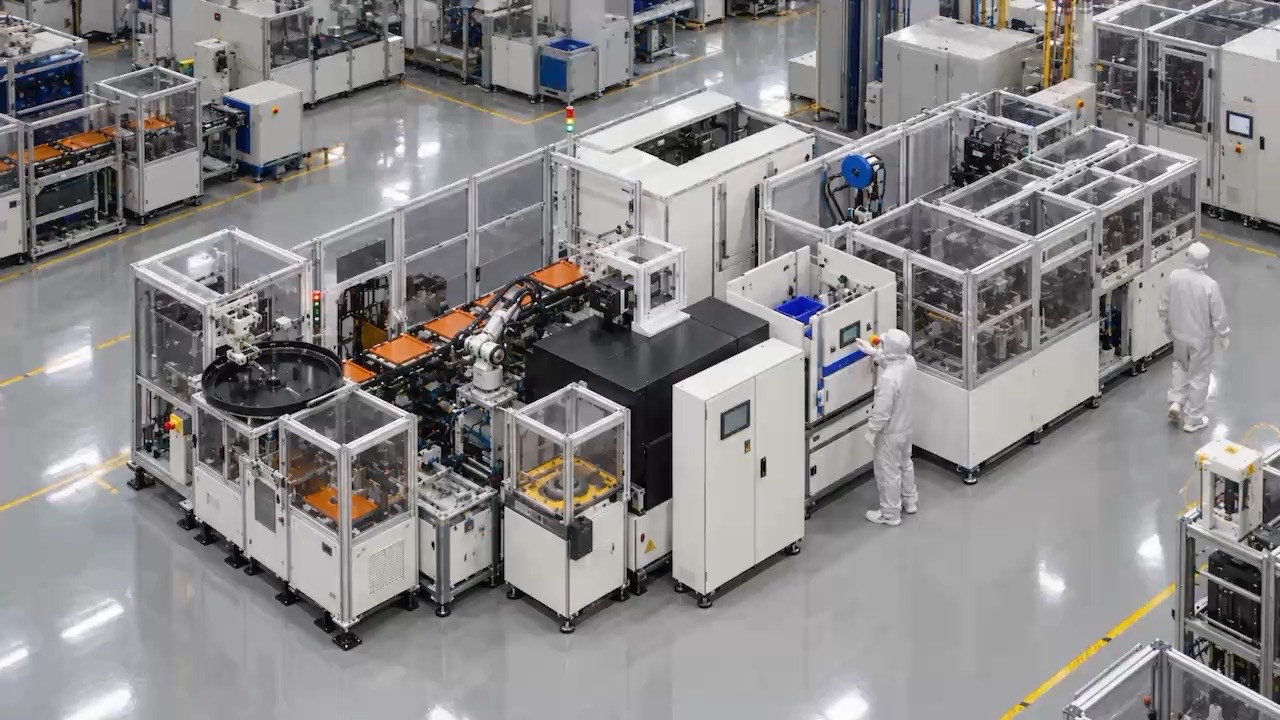
IllustrativeChip packing lineInner-Box Auto Packer
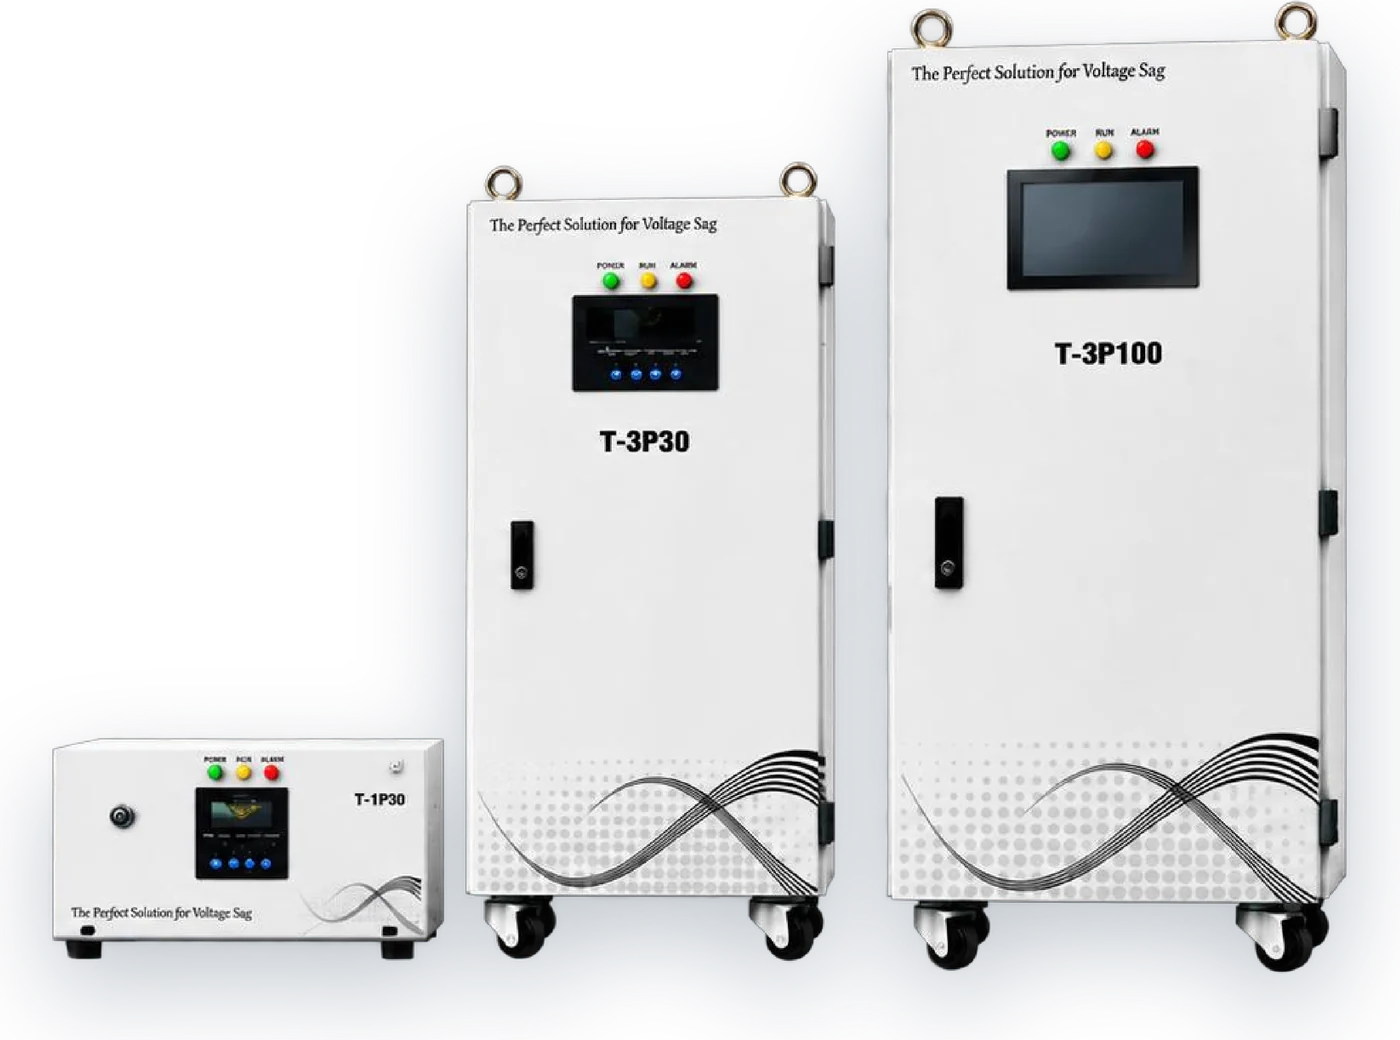
IllustrativeFab production lineVoltage Sag Protector
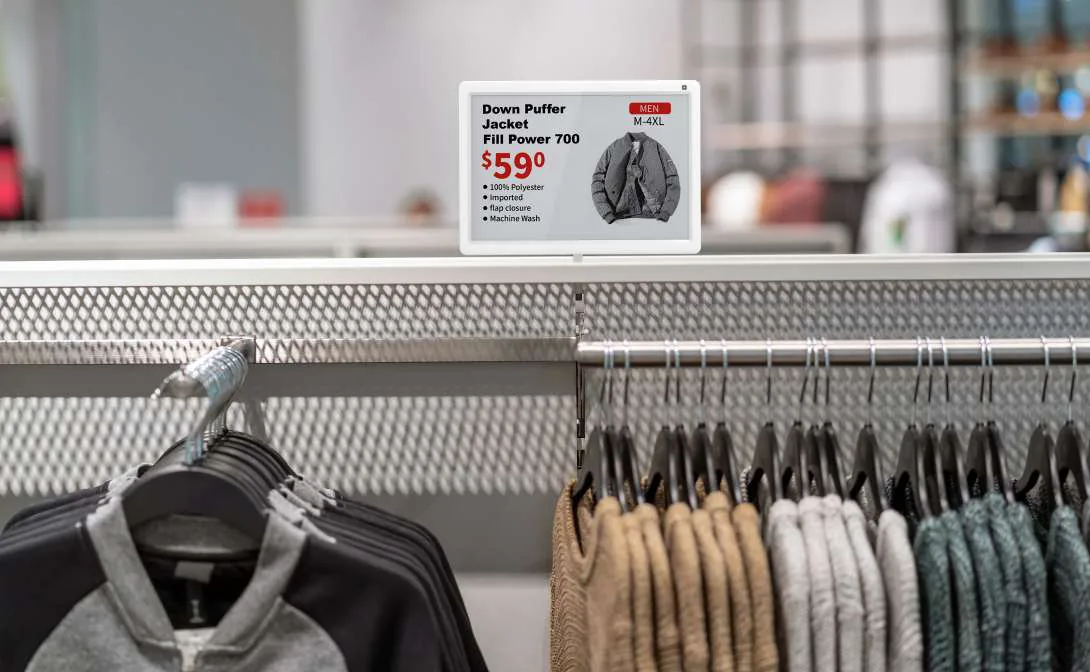
IllustrationInternational airport boarding bridgeRadiative cooling film × airport bridge
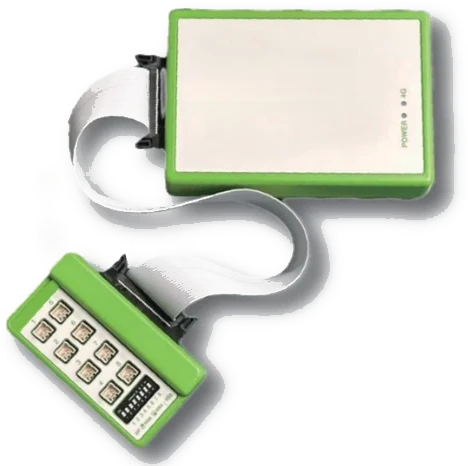
IllustrativeGerman buyer × Taiwan makerB2B Growth
What we do ・ 01
For: factories, facilities, buyers

Tech & Equipment

  • Overseas tech and equipment distribution
  • Tech and system integration
  • Local install, training, service
View solutions
What we do ・ 02
For: equipment and tech makers, overseas brands

B2B Growth

  • B2B websites, multilingual content
  • Google Ads / LinkedIn ads, SEO and GEO
  • Lead generation and sales funnels
See B2B Growth
Start from your problem

What's your problem?

Start from the problem — no product name needed.

Your industry
View all solutions →
Proof, not promises

Proof, not promises

Each number is marked as measured, case average or spec — click to see how it was measured. No estimates here. E / S = ESG area. Our ESG approach →

Methods public, bad data included, measured vs. estimated labeled. All cases →

Featured case

Featured case

HVAC savingFeatured · cross-season test

No new AC, 12.2% summer saving: a retail store test

A clothing store added passive panels to its AC. We compared energy use before and after across spring and summer, matching time of day, outdoor temperature and units running.

Site
An international chain clothing store in northern Taiwan
Scale
12 outdoor units, 3 of them the main test units
Period
2026/2/26 – 8/5 (spring and summer)
7.8%Spring saving
12.2%Summer saving
13.5%All 12 units
Read the case
Fig. 01 — 12 outdoor units in summerAverage hourly energy use
BeforeAfter
Main test units1234Unit A before 1.28 kWh/hUnit A after 1.16 kWh/hAUnit B before 0.78 kWh/hUnit B after 0.69 kWh/hBUnit C before 1.02 kWh/hUnit C after 0.85 kWh/hCUnit D before 0.28 kWh/hUnit D after 0.35 kWh/hD+0.07Unit E before 1.3 kWh/hUnit E after 1.17 kWh/hEUnit F before 4.34 kWh/hUnit F after 3.58 kWh/hFUnit G before 1.09 kWh/hUnit G after 1.03 kWh/hGUnit H before 1.2 kWh/hUnit H after 0.95 kWh/hHUnit I before 0.4 kWh/hUnit I after 0.36 kWh/hIUnit J before 2.06 kWh/hUnit J after 1.76 kWh/hJUnit K before 0.73 kWh/hUnit K after 0.68 kWh/hKUnit L before 1.41 kWh/hUnit L after 1.15 kWh/hLkWh/h
Overall15.87→13.74kWh/h−13.5%

11 of 12 units dropped; Unit D rose 0.07 kWh/h, shown as is. Not condition-matched; trend only.
ESG, measured

Every solution maps to
measurable ESG outcomes

We only claim what we can measure: a baseline first, data after, estimates labeled.

Related UN SDGs
  • SDG 7 Affordable and Clean EnergyClean Energy
  • SDG 8 Decent Work and Economic GrowthDecent Work
  • SDG 9 Industry, Innovation and InfrastructureIndustry & Innovation
  • SDG 12 Responsible Consumption and ProductionResponsible Production
  • SDG 13 Climate ActionClimate Action
How we approach ESG →
Partners

A two-way bridge

We bring global technology to Taiwan, and Taiwanese technology to the world. Have something great? Let's build the bridge.

Become a partner
GLOBAL TAIWAN Global Tech · equipment Taiwan Production lines Bring in tech → Tech · products Overseas markets ← Find markets 帝亞智能
Let's build it together

Great technology, shining in the right market.

Equipment, technology or market development — it starts with a talk. We learn your situation, then give a first assessment.