Power Monitoring MeterClamp on, find the big users, then decide what to fix
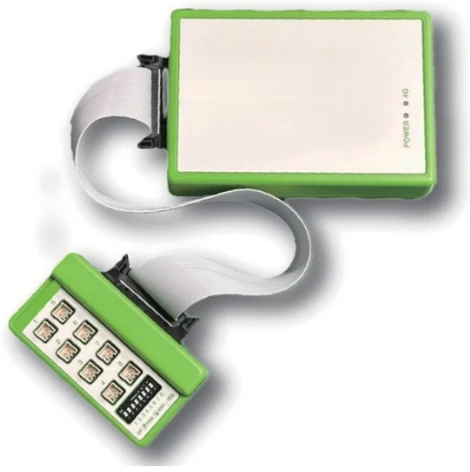
The power monitoring meter clamps onto circuits in your electrical panel and automatically uploads how much energy each circuit uses, and when, to the cloud. It doesn't save energy by itself — it shows you where the energy goes. Find the big users and the waste first, then decide whether to adjust operation, fix anomalies or add energy-saving equipment, and verify the results afterward with the same meter.
ESG positioning: E (Environmental) + G (Governance)How DEYly approaches ESG →
- Proven benefits
- Find the equipment that uses the most energy, or keeps consuming when nothing is being produced, and start saving where the share is largest (E); energy use, cost and calculated CO₂ are logged automatically, so measures can be compared before and after (G).
- Limits
- The meter itself doesn't save energy — savings come from the improvements made after measuring. CO₂ is an estimate based on the grid emission factor and does not replace a formal carbon inventory.
Find the culpritNot sure where to save? Measure first
The power bill only tells you how much the whole plant used — not which equipment or which hours. Clamp the meter's CTs onto each circuit in the panel and you can see each circuit's share of energy. The rule for saving energy is simple: start where the share is largest.
Energy and load: the higher the load, the higher the current and the more power consumed (P = I²R). Added load from indoor/outdoor temperature differences or dirty filters shows up directly in the current, so measuring current reveals where energy is wasted.
DashboardWhat data can you see?
Measurements are uploaded to the cloud automatically over 4G and can be viewed on a computer, tablet or phone — no extra network cabling or connection to the company LAN.
Energy use and cost
Live energy and running cost per circuit, any period.
CO₂ emissions
Emissions from energy use, to track carbon cuts.
Indoor/outdoor temperature
Logged alongside, so weather can be ruled out in comparisons.
CSV export
Export data for reports; manage several meters on one screen (optional).
ResultsWhat was improved after measuring?
These are the manufacturer's improvement records from factories in Japan after finding problems with the meter. What they have in common: none of the problems were solved by buying new equipment — measuring revealed wasteful operation.
Air compressor split across two units
One compressor ran at 93% load, about 14 kW; split across two, the average fell to about 5 kW.
Manufacturer example · JapanFound a load that never stopped
A rarely used machine drew power nonstop — no breaker on its transformer. Fixed: that circuit dropped 88%.
Manufacturer example · JapankW off contract capacity
Ongoing tuning cut ~116,000 kWh a year; contract capacity fell from 171 to 143 kW.
Manufacturer example · JapanSavings depend on the equipment on site and the measures taken. These are real examples and don't mean every site will achieve the same numbers.
SpecificationsSpec
| Item | 100 A model | 400 A model |
|---|---|---|
| Measurement range | 0.5~100 A | 50~400 A |
| Circuits | 8 circuits (8 CTs and leads included) | |
| Installation | CTs clamp on — no cutting, no shutdown | |
| Data transmission | 4G to the cloud; first 2 years of fees included | |
| Display | Energy, cost, CO₂, indoor/outdoor temperature; any period | |
| Data output | CSV export; API on request | |
| Availability | Buy or rent (min. 3 months — good for a trial) | |
Work inside the panel must be done by a qualified electrician; we'll assess circuit selection and CT specs based on your panel first.
ImplementationHow to deploy: 5 steps
- 01SurveyPick main circuits: chillers, pumps, compressors.
- 02InstallClamp on, no shutdown.
- 03Baseline2–4 weeks of data.
- 04ImproveStart with the biggest, easiest share.
- 05CompareSame meter, before vs. after.
To verify energy-saving equipment, compare baseline and improvement periods under similar conditions — see how to verify AC energy savings.
FAQCommon questions
What is a power monitoring meter?
CTs (current sensors) clamp onto circuits in your panel to measure each circuit's energy use and upload it over 4G to the cloud, so you can see on a computer or phone which equipment uses how much and when. It's used to find waste, decide what to fix first and verify energy-saving measures.
Does installation require a shutdown?
No. The CTs clamp around existing wires — no cutting or shutdown. Work inside the panel must still be done by a qualified electrician.
How many circuits can one unit measure?
Eight at once. There are two models by current range, 0.5–100 A and 50–400 A; data from multiple meters can be combined on one screen.
Does it need to connect to the company network?
No. Data goes to the cloud over 4G — no network cabling, no connection to the company LAN.
Can I rent instead of buying?
Yes. The meter can be purchased or rented, with a minimum 3-month rental — good for measuring for a while, finding the problems and then deciding on long-term use.
Will installing the meter save energy?
The meter itself doesn't save energy. Its value is showing you energy shares and waste; the savings come from what you do after measuring — adjusting operation, fixing abnormal consumption or adding energy-saving equipment.
Savings depend on equipment, electricity prices and the measures taken; the examples above are the manufacturer's records from factories in Japan, for reference only.