Summary: how much can a small 24-hour store save?
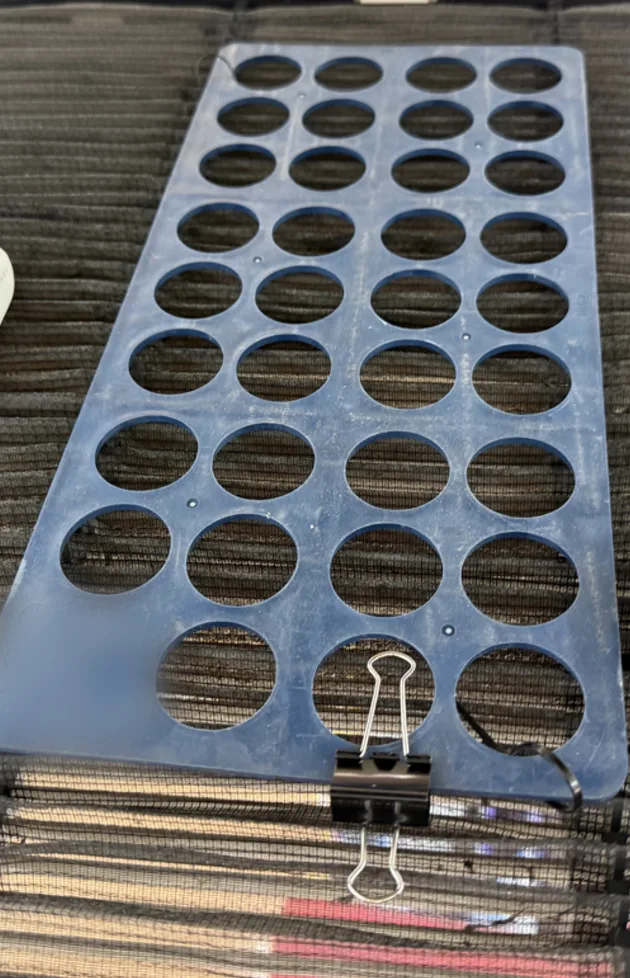
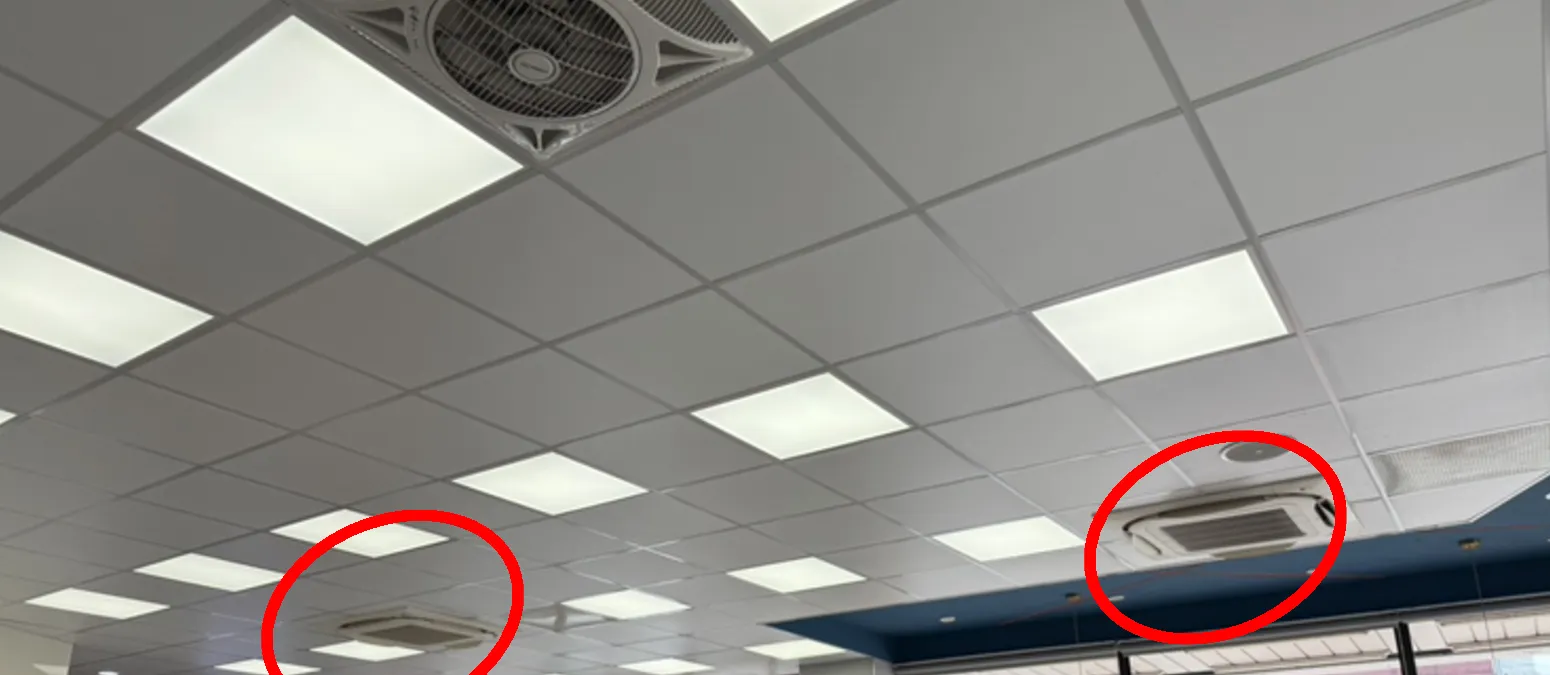
A 24-hour chain convenience store added one passive energy-saving panel (HVAC energy-saving panel) to each of its 2 existing ceiling cassette AC units — no AC replacement, no power, no disruption to business. It was measured continuously for 14 days before and after: grouped by outdoor temperature, energy fell in all 9 bins from 25 to 33°C; comparing two days with similar outdoor temperatures hour by hour, the daily saving was 6.95%. Total 14-day energy fell 17.05%, but the two weeks after installation were about 1°C cooler on average, so that number includes help from the weather — we treat it as an upper bound, not the main conclusion.
Why start with convenience store AC?
Convenience stores never close: the AC runs 24 hours a day while the doors keep opening and closing, so it hardly ever rests. Each store has only a few units, but chains run thousands of stores — a little saved at each adds up to a lot.
New AC
- High equipment and installation costs
- Requires store closure or overnight work
- Hard to replace thousands of stores at once
Add panels to existing AC
- Installed directly on the return-air side of indoor units
- No power, no piping changes
- Can be installed during business hours
- Pilot one store, let data decide whether to expand
The purpose of this test was to confirm, in a real store open for business, how the panels perform on small AC units that run all day, as the basis for deciding whether to expand to other stores.
Method: 14 days before and after, weather removed
| Item | Details |
|---|---|
| Before installation | 2025/6/18 – 7/1, 14 days (336 hours) |
| After installation | 2025/7/3 – 7/16, 14 days (336 hours) |
| Measurement hours | 0:00–23:59 daily (24 hours) |
| AC settings | Cooling · 26°C · auto fan (unchanged) |
| AC type | 2 ceiling cassette units |
| Data measured | Energy every minute; store temp/humidity every 3 min; outdoor temp from a weather station |
A convenience store's energy use changes daily with weather, customer traffic and work schedules, so comparing totals alone isn't fair. Besides total energy, this case ran two comparisons that exclude weather: grouping by outdoor temperature and comparing two days with similar outdoor temperature patterns hour by hour.
14-day total energy: down 17.05%, but the weather helped
| Period | Avg. outdoor temp | Total energy |
|---|---|---|
| Before (6/18–7/1, 14 days) | 30.63°C | 743.60 kWh |
| After (7/3–7/16, 14 days) | 29.57°C | 616.83 kWh |
| Difference | −1.06°C | −126.78 kWh(−17.05%) |
The two weeks after installation averaged 1.06°C cooler outdoors than before — and the cooler it is outside, the less energy the AC uses anyway. So part of the 17.05% comes from the weather; we treat it as an upper bound, and the two comparisons below are the results with weather excluded.
By outdoor temperature: all 9 bins lower after installation
Each hour was grouped by its outdoor temperature, and average energy before and after installation was compared within the same temperature bin — in other words, which uses less energy "when it's equally hot."
Average energy by outdoor temperature (kWh)
| Outdoor temperature | 25°C | 26°C | 27°C | 28°C | 29°C | 30°C | 31°C | 32°C | 33°C |
|---|---|---|---|---|---|---|---|---|---|
| Before | 0.72 | 1.65 | 1.04 | 2.37 | 2.88 | 2.50 | 3.19 | 3.95 | 5.24 |
| After | 0.55 | 1.25 | 0.61 | 1.90 | 2.66 | 2.12 | 2.17 | 2.78 | 4.73 |
| Difference | −0.17 | −0.40 | −0.43 | −0.47 | −0.22 | −0.38 | −1.02 | −1.17 | −0.51 |
| Reduction | −24% | −24% | −41% | −20% | −8% | −15% | −32% | −30% | −10% |
In all 9 bins from 25 to 33°C, average energy fell after installation, by 8%–41%. Because each bin has a different number of hours, the reductions can't simply be averaged into a single saving rate; this comparison confirms that "under the same weather, the effect points the same way."
Two similar days, hour by hour: 6.95% daily saving
We then picked the two days with the closest outdoor temperature patterns: 6/30 before installation (average 31.5°C) and 7/4 after (average 31.7°C). The post-installation day was even slightly hotter. Energy from 10:00 to 22:00, hour by hour:
| Time | 6/30 outdoor (before) | 7/4 outdoor (after) | 6/30 energy (kWh) | 7/4 energy (kWh) | Change (kWh) | Change rate |
|---|---|---|---|---|---|---|
| 10:00 | 33.5°C | 33.6°C | 3.83 | 3.56 | −0.27 | −7.0% |
| 11:00 | 33.9°C | 34.2°C | 3.93 | 3.35 | −0.58 | −14.8% |
| 12:00 | 34.0°C | 34.4°C | 4.01 | 3.28 | −0.73 | −18.2% |
| 13:00 | 34.4°C | 34.8°C | 3.94 | 3.30 | −0.64 | −16.2% |
| 14:00 | 33.9°C | 34.4°C | 3.55 | 3.21 | −0.34 | −9.6% |
| 15:00 | 34.1°C | 33.4°C | 3.83 | 3.23 | −0.60 | −15.7% |
| 16:00 | 33.4°C | 33.0°C | 4.00 | 3.63 | −0.37 | −9.3% |
| 17:00 | 33.2°C | 32.2°C | 4.07 | 3.64 | −0.43 | −10.6% |
| 18:00 | 31.8°C | 31.3°C | 3.91 | 3.51 | −0.40 | −10.2% |
| 19:00 | 31.8°C | 31.1°C | 3.09 | 3.74 | +0.65 | +21.0% |
| 20:00 | 31.4°C | 30.9°C | 2.60 | 3.42 | +0.82 | +31.5% |
| 21:00 | 31.3°C | 30.8°C | 2.16 | 2.16 | ±0.00 | ±0.0% |
| 22:00 | 31.3°C | 30.2°C | 1.66 | 1.45 | −0.21 | −12.7% |
| Total | Average 31.5°C / 31.7°C | 44.58 | 41.48 | −3.10 | −6.95% | |
Of 13 time slots, 10 dropped and 21:00 was flat; 19:00 and 20:00 actually rose after installation (+21.0%, +31.5%). A convenience store's hourly energy swings with customer traffic, door openings and work schedules, so single hours fluctuate a lot; we show them as measured and don't remove unfavorable data. The daily total fell from 44.58 kWh to 41.48 kWh, a 6.95% saving.
Annual benefit: energy, cost and carbon
Using the measured range of 7% (two similar days) to 17% (14-day total), the estimated annual benefit is:
| Item | Estimate | Calculation |
|---|---|---|
| Annual energy use | About 13,127 kWh/yr | Rated total 6.00 kW × power factor 90% × annual average load factor 30.8% (referencing a similar climate) × aging factor 0.901 × 8,760 operating hours/yr (24 h × 365 days) |
| Yearly energy saved | About 919–2,231 kWh/yr | Annual energy × saving rate 7%–17% |
| Yearly cost saved | About NT$3,492–8,478/yr | Annualized saving × average commercial rate NT$3.8/kWh |
| Yearly CO₂ cut | About 0.44–1.06 t CO₂e/yr | Annualized saving × 2024 grid emission factor 0.474 kg CO₂e/kWh |
| Payback | About 1–2.3 years | At 17% and 7% saving |
These are annualized estimates based on the measured saving rate, not full-year data measured during the test. One store has only 2 small AC units, so the amounts are modest; the real value is in replicating across a chain. Actual benefits vary with AC operating hours, load, electricity price, equipment price and deployment scale, and need to be estimated case by case.
What does this case tell us?
Small, round-the-clock AC units show results too. Compared with the cross-season clothing store test (12.2% summer saving), this convenience store has smaller units and a shorter measurement period, but under the same weather conditions the effect points the same way.
Don't look at total energy alone. The 17% looks great, but it happened to be cooler after installation. We chose to put the weather-excluded 7% in the headline, label 17% as the upper bound, and list the hours when energy rose. That's how we "prove value with results": publish the test method, list unfavorable data, and clearly separate measured results from estimates.
FAQ
How much energy can energy-saving panels save on a convenience store's AC?
In this case, comparing two days with similar outdoor temperatures hour by hour showed a 6.95% saving; grouped by outdoor temperature, energy fell in all 9 bins from 25 to 33°C after installation. Total 14-day energy fell 17.05%, but the post-installation period was about 1°C cooler on average, so that figure includes weather effects and should be treated as an upper bound.
Why not just use 17% as the saving rate?
Because the weather differed between the two periods: the 14 days before installation averaged 30.63°C outdoors, the 14 days after 29.57°C. The cooler it is, the less energy AC uses anyway, so part of the 17.05% total reduction came from the weather. The two weather-excluded comparisons (temperature bins and two similar days) are the more conservative, credible results.
Why did energy rise in two hours of the hourly comparison?
In the two-day hourly comparison, energy at 19:00 and 20:00 was higher after installation than before, and 21:00 was flat. A convenience store's energy is affected by customer traffic, door openings, deliveries and work schedules, so single hours fluctuate widely; we show them as measured, don't remove unfavorable data, and use the daily total of −6.95% as the result of this comparison.
Were the annualized savings and payback measured?
No. The annualized saving of about 919–2,231 kWh, about NT$3,492–8,478 in power costs and payback in about 1–2.3 years are all estimates based on the measured 7–17% saving rate, with the annual average load factor referencing a similar climate. Actual benefits vary with operating hours, load, electricity price, equipment price and deployment scale, and need to be estimated case by case.